Our 2022 House Election Forecast is Now Live. Here's How It Works.

Photo credit: House Forecast
By: Logan Phillips, Editor in Chief
Date: February 7th
Today, RacetotheWH is officially launching our House Forecast, which will project the result for every single one of the 435 congressional seats up in 2022. This was a uniquely tough challenge because the forecast must predict how each newly drawn district will vote, in a cycle where many incumbents will be running on entirely new political turf.
However, I think the new forecast is up to the task. It was tested relentlessly on the over 2,000 Congressional races in the past decade and fine-tuned until it could successfully predict over 96.5% of races correctly.
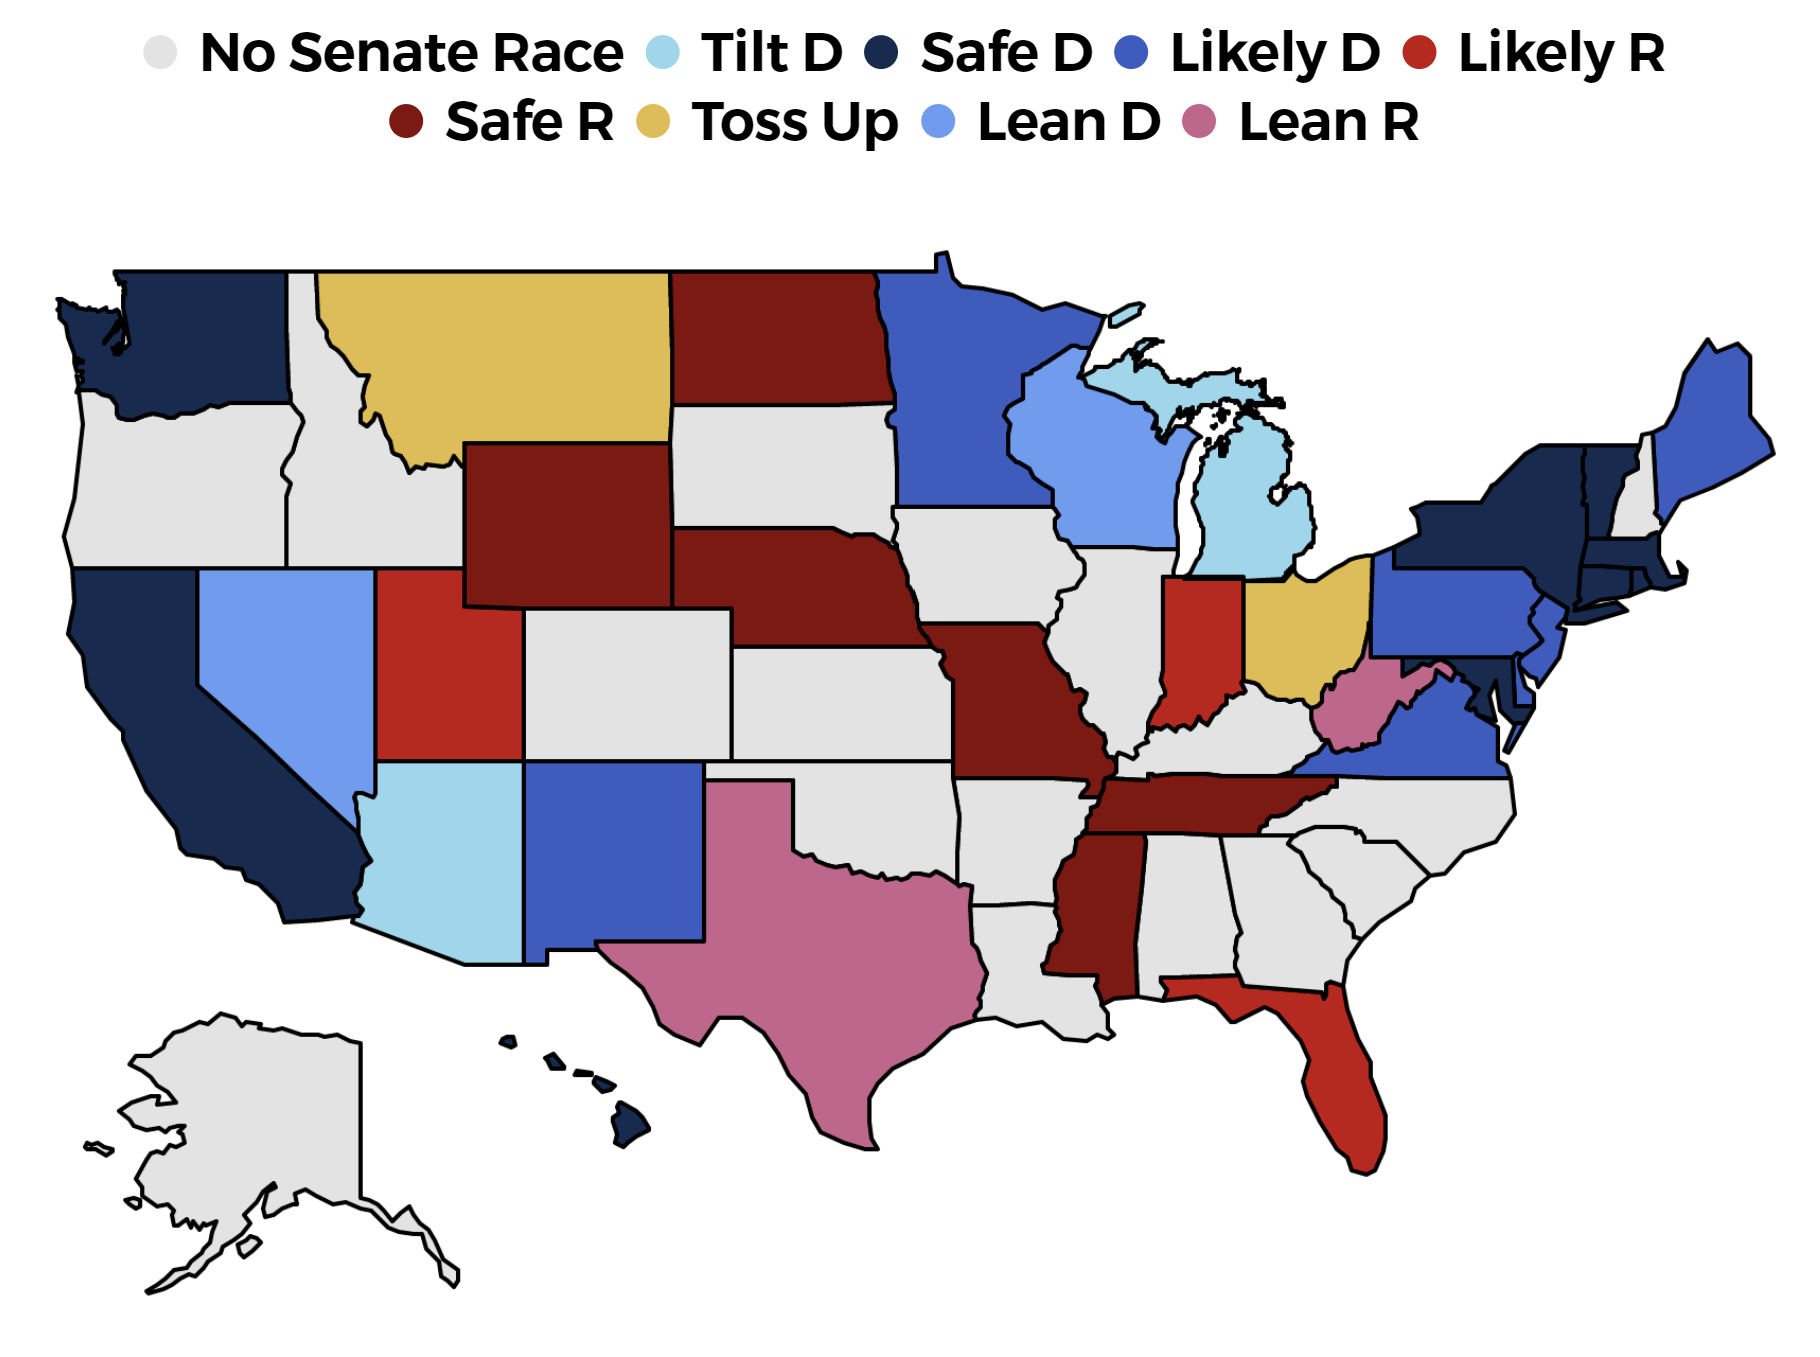
This race looks quite different than I expected when I started designing this forecast. Even a month ago, I anticipated that Democrats were destined for defeat. I thought the forecast would have them at about a 15% chance of keeping their majority, projected to finish with less than 195 seats. Instead, Democrats have a surprisingly realistic chance to hold their majority, although, as expected, Republicans are the favorites. At launch, the forecast gives Democrats a 33.7% chance at an upset, and Republicans a 66.3% chance of flipping the House.
Democrats' odds rose because they are playing on a radically different political battleground than they were in the 2010s. Republicans caught Democrats flat-footed a decade ago when they tripled down on the practice of gerrymandering - or in other words, drawing maps to maximize a party's political advantage by packing voters into the districts that will help them win the most seats possible. It gave Republicans an easy lane to victories in the House, and throughout the 2010s they only needed to keep their deficit in the national popular vote to at least 3% or less to win the election.
Under the old map, Democrats' chances of keeping the majority would be well under 25%. However, this time around Republicans has not been able to secure the same advantage. For one, they control fewer states than they did after their historic victory in 2010. For another, Democrats have been much more aggressive at gerrymandering than last decade. If Democrats win the popular vote by at least 0.5%, the forecast anticipates they would be favored to win.
How the Forecast Works
I used the 2020 Senate forecast as a basis for the House Forecast, which was one of the most accurate in the nation in 2020. At this early stage, it was able to call about 95% of the last decade's house races correctly. I worked on new features for the forecast that might improve its accuracy, and then tested them. I only kept those that improved the accuracy of the projection. I also fined-tuned every variable to ensure the forecast was well-tuned to the unique dynamics of House elections.
The forecast uses seven primary indicators to project the margin of victory in each race. First, it starts with the Partisan Lean of each congressional district, which represents how people voted in the last two presidential election cycles relative to the national popular vote. In races without polling, this is the most important factor.

Explore the latest polling and projections for
the Senate Forecast, updated daily.
Second, if one of the candidates is an incumbent, the forecast includes the Incumbent's Margin of Victory in the Last Election. Their margin is adjusted to consider three factors:
1. The National Environment in 2020 (Democrats won the House by 3.1%, so this adjustment helps Republicans)
2. The Type of Election (Large boost for candidates that successfully challenged an incumbent, small boost for candidates that won an open race)
3. Changes in the Partisan lean of their Congressional District (If a Republican’s new district is 1% more Democratic than 2020, their margin would be reduced by 1%)
The last adjustment is particularly important in 2022 because many representatives are running in newly drawn congressional districts.
Third, I look at the Political Experience of both candidates. Each type of experience is given a point total, and the candidate with the higher point total gets a boost. Incumbents perform much better in elections than first-time candidates, state senators, local politicians, and state reps. They do, however, underperform against governors and big-city mayors. If we only have a likely nominee for one party, the impact of Political Experience is cut in half, and I assume their opponent will have the same level of experience as the average non-incumbent over the last decade.
Fourth, I include Fundraising. Candidates that raised considerably more money do better in the forecast. To ensure balance, I had to give all challengers' fundraising a boost before assessing which candidates raised more because challengers tend to lag well behind incumbents in the early stages of the election. They get a 33% bump at launch, which will decrease to a little under 15% by election day. Fundraising is only a factor when there is a likely nominee for both parties, and when both candidates were active long enough in the last financial quarter to have a chance to raise money.
The fifth factor is the Polling Average. Like with the Senate and Governor races, our polling average gives more weight to recent polls, from pollsters with excellent track records, and to those with large sample sizes. We also correct for bias. At launch, only a handful of races have any polling, but this will be a very important factor as we get closer to the election.
Sixth, I include the National Political Environment. This is a combination of historic trends, which favor the party out of the White House, (Republicans in 2022), and the National Generic Ballot.
Finally, in the states that have open runoff elections where all parties run together, I include the Margin from the First Round of Elections. This only applies in a few states, including California and Washington. It sometimes is active in Georgia and Louisiana, which hold the second round of elections if neither candidate gets over 50% support on the traditional election day in November. I should also note that up until the primaries are finished and a final party candidate is chosen, I will also be using the Cook Political Reports and Sabato's Crystal Ball's house ratings in the forecast.
Chance of Winning
The next step is to estimate the chance both parties have of winning each race, using the projected margin of victory, and how much uncertainty there is in each race. In other words, that means how much I expect the result could differ from the projection. Uncertainty increases when:
We are further away from election day
There is no incumbent
There is no polling
There are a high number of undecided voters
The polling indicates a very different result than the rest of the forecast.
I use something called a normal distribution function for each race, which assumes the actual result is as likely to be above as below the projection. It tells me how likely it is that Democrats or Republicans will win. I use the projected margin of victory for the mean and the uncertainty for the variance.
Simulation
The last key piece of information I want to project is how likely each party is to secure a Congressional Majority. I built a simulation that runs through all 435 districts, 20,000 times a day, to determine how likely each party is to secure the 218 districts they need to win.
These races don't exist in a vacuum. Often, one party performs better than expected nationally, in some regions, and with certain demographic groups. I look to simulate a wide range of possibilities to accurately predict how likely the forecast is to be wrong. Races that share similar traits have higher degrees of correlation. I determine the correlation of each race using:
Region
State
Racial Demographics
Incumbent Status
Partisan Lean
Locality (Urban, Suburban, Rural)
I am not yet using racial demographics or locality since the congressional maps are not yet approved in every state, but I will once all the maps are accepted.
Maps
I've had to make assumptions about what maps will be used in the states that haven't finalized their congressional districts. I will adjust these as new maps are passed, and as previously passed maps are confirmed or struck down. You can see the status of each map in the interactive map in the forecast, under the "Status" tab.
Updates
Every day, the House forecast will be updated to include new information, which will likely change the dynamics of the race. These include:
New Maps Approved
New Challengers Announces
Incumbent's Retiring
New Polling
Primaries are Completed
New Fundraising Reports
Changes in the National Polling
Additionally, the forecast will change on its own every day we get closer to the election. The uncertainty will decrease over time. I also will raise the maximum cap on what percent of the projection polling can be. The cap is at 50% today and will rise to just under 80% by election day.
Follow the latest updates to the forecast right here, in an interactive feature showing our predictions for every race. Be sure to follow our predictions for the Senate election and Governor election as well, which are updated daily.